
Checking for missing content type metadata ...
This resource contains content types with missing metadata required to make it public or discoverable. Show missing content type metadata.
Click on the edit button ( ) below to edit this resource.
Checking for non-preferred file/folder path names (may take a long time depending on the number of files/folders) ...
This resource contains some files/folders that have non-preferred characters in their name. Show non-conforming files/folders.
This resource contains content types with files that need to be updated to match with metadata changes. Show content type files that need updating.
| Authors: |
|
|
|---|---|---|
| Owners: |
|
This resource does not have an owner who is an active HydroShare user. Contact CUAHSI (help@cuahsi.org) for information on this resource. |
| Type: | Resource | |
| Storage: | The size of this resource is 57 bytes | |
| Created: | May 19, 2025 at 11:04 p.m. (UTC) | |
| Last updated: | May 23, 2025 at 3:20 a.m. (UTC) | |
| Citation: | See how to cite this resource |
| Sharing Status: | Public |
|---|---|
| Views: | 1681 |
| Downloads: | 50 |
| +1 Votes: | Be the first one to this. |
| Comments: | No comments (yet) |
Abstract
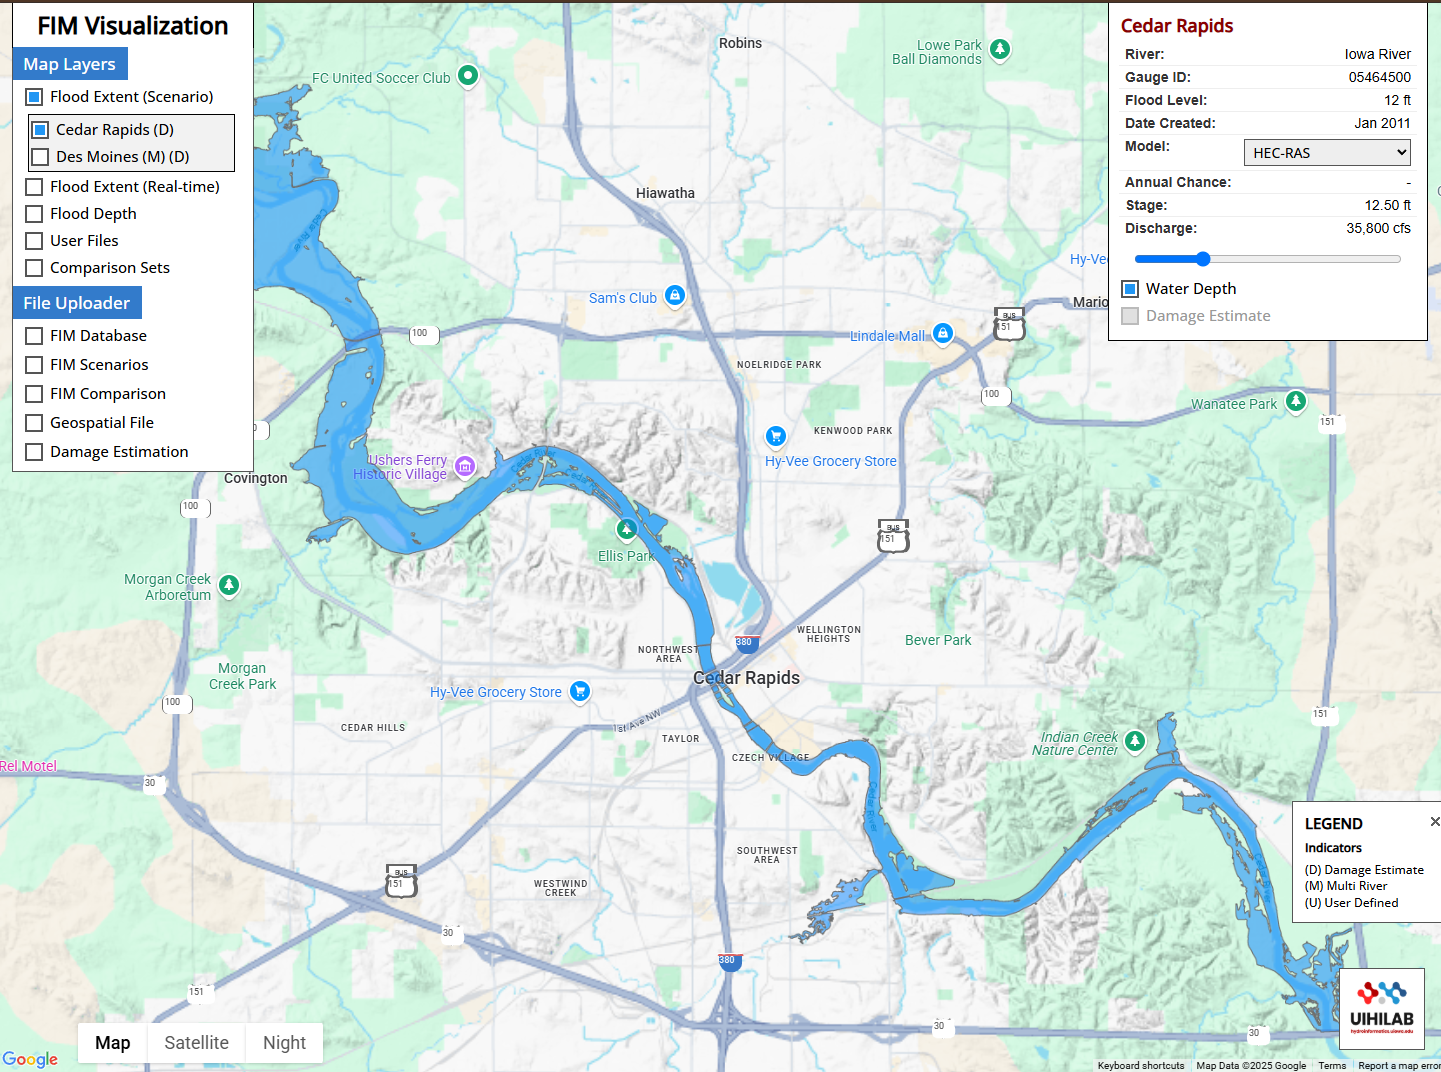
The Flood Inundation Mapping (FIM) Visualization Deck is a web-based application designed to display and compare flood extent and depth information across various temporal and scenario conditions. It provides a front-end interface for accessing geospatial flood data and interacting with mapped outputs generated from hydraulic modeling.
Core Functions:
• Flood Extent Mapping: Visualizes flood extents from modeled scenarios (e.g., 2-year, 10-year, 100-year events) and real-time conditions based on streamflow observations or forecasts.
• Flood Depth Visualization: Displays depth rasters over affected areas, derived from hydraulic simulations (e.g., HEC-RAS).
• Scenario Comparison: Allows side-by-side viewing of multiple FIM outputs to support calibration or decision analysis.
• Layer Management Toolbox: Users can toggle basemaps, adjust layer transparency, load datasets, and control map extents.
Data Inputs:
• Precomputed flood inundation extents (raster/tile layers)
• Depth grids
• Stream gauge metadata
• Associated hydraulic model outputs
Technical Stack:
• Front-end: Built with JavaScript, primarily using Leaflet.js for interactive map rendering.
• Back-end Services: Uses GeoServer to serve raster tiles and vector layers (via WMS/WFS). Uses OGC-compliant services and REST endpoints for data queries.
• Data Formats: Raster layers (e.g., GeoTIFF, PNG tiles), vector layers (GeoJSON, shapefiles), elevation models, and model-derived grid outputs.
• Database: Integrates with a PostgreSQL/PostGIS backend or similar spatial database for hydrologic and geospatial data management.
• Deployment: Hosted via University of Iowa infrastructure, with modular UI elements tied to specific watersheds or study areas.
Intended Use:
The application provides a reference and exploratory tool for comparing modeled flood scenarios, visualizing extent and depth data, and interacting with region-specific inundation data products.
Subject Keywords
Coverage
Temporal
| Start Date: | |
|---|---|
| End Date: |
Content
Additional Metadata
| Name | Value |
|---|---|
| page_url | https://hydroinformatics.uiowa.edu/lab/fims/ |
| thumbnail_url | https://ciroh-portal-static-data.s3.us-east-1.amazonaws.com/e789749b-b5f4-4a9e-ba74-dffca2e107b3.png |
Credits
Funding Agencies
This resource was created using funding from the following sources:
| Agency Name | Award Title | Award Number |
|---|---|---|
| National Oceanic and Atmospheric Administration (NOAA), University of Alabama | CIROH: Enabling collaboration through data and model sharing with CUAHSI HydroShare | NA22NWS4320003 to University of Alabama, subaward A23-0266-S001 to Utah State University |
How to Cite
This resource is shared under the Creative Commons Attribution CC BY.
http://creativecommons.org/licenses/by/4.0/
Comments
There are currently no comments
New Comment